My2drops client's dashboard
2022 | Illustrator
My2drops optimizes the use of water in irrigation through an intelligent device which predicts the weather based in evapotranspiration model, a flowmeter and a garden design advisory. As a result, your garden will be irrigated with the precise amount of water.
The challenge for me as a designer was to create the user platform, in which they could check in real time the amount of water that has been saved, the alarms that the system rises and a lot of information all at once. So I designed an interface divided in 3 sections to bring neat information organized by priorities.
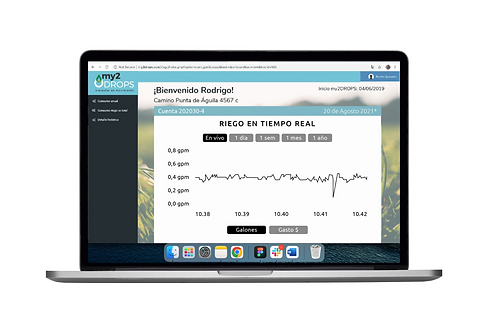
Online data displayed
With this graphic as a first dashboard on the platform, you are able to easily see the behavior of the irrigation in gallons in different time gaps. You can change the time laps to see the same irrigation graphic either on live, 1 day, 1 week, 1 month or 1 year.
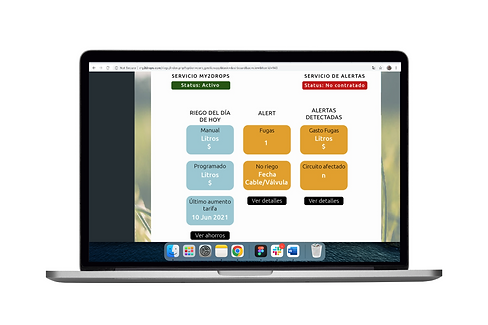
Simplicity to analyze better
As the platform was designed to monitor the irrigation system's data of big green areas at homes, schools, universities and companies, we needed it to be easy to analyze, even though there was a lot of data to show.
So I decided to paint in light blue the squares related directly to the daily irrigation, and in yellow the ones that are related to alarms of non irrigating and leaks.
The scope of the project
This involved creating a digital platform that enabled users to monitor and control their irrigation systems based on intelligent weather predictions and flowmeter data. The project aimed to empower users to irrigate their gardens with precision, using only the necessary amount of water, thereby conserving resources and reducing water wastage. The interface's clarity and functionality made it a valuable tool for users seeking to make more environmentally conscious choices in their garden irrigation.
UX/UI design process
The UX process began with user research and a deep understanding of the system's functionalities and user requirements. Then, focused on information architecture, grouping information into three distinct sections based on priorities. Wireframing and prototyping allowed for iterative testing and refinement. Collaboration with developers was crucial to ensure the seamless integration of design with the technical aspects of the system. The project also involved usability testing to validate the user interface's effectiveness.
Results
My role
The designed interface effectively provided users with real-time insights into their irrigation system's performance, showcasing water savings and system alarms prominently. By organizing information into three clear sections, the interface presented data in a user-friendly and organized manner. The outcome of the project not only enhanced user experience but also contributed to the overall mission of My2drops in conserving water resources and promoting sustainable gardening practices.
My role was to create an intuitive and user-friendly platform that effectively conveyed critical information to users in real-time. This included designing an interface that allowed users to monitor water savings, system alarms, and access a wealth of information while maintaining a clean and organized appearance for people that is less technology friendly. The designer's responsibility was to ensure that the user interface addressed user needs and priorities effectively.